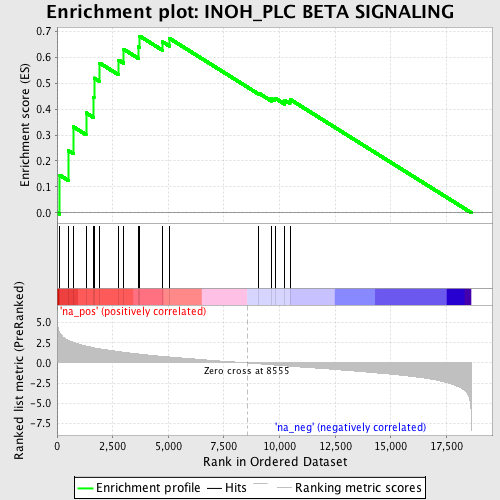
Profile of the Running ES Score & Positions of GeneSet Members on the Rank Ordered List
| Dataset | set04_transDMpreB_versus_DMpreB |
| Phenotype | NoPhenotypeAvailable |
| Upregulated in class | na_pos |
| GeneSet | INOH_PLC BETA SIGNALING |
| Enrichment Score (ES) | 0.68210465 |
| Normalized Enrichment Score (NES) | 2.1641014 |
| Nominal p-value | 0.0 |
| FDR q-value | 0.008640011 |
| FWER p-Value | 0.018 |
| PROBE | GENE SYMBOL | GENE_TITLE | RANK IN GENE LIST | RANK METRIC SCORE | RUNNING ES | CORE ENRICHMENT | |
|---|---|---|---|---|---|---|---|
| 1 | ITPR3 | 123 | 3.720 | 0.1451 | Yes | ||
| 2 | MAP2K1 | 502 | 2.825 | 0.2399 | Yes | ||
| 3 | ITPR1 | 728 | 2.554 | 0.3320 | Yes | ||
| 4 | MAPK3 | 1303 | 2.079 | 0.3859 | Yes | ||
| 5 | MAP2K2 | 1638 | 1.892 | 0.4451 | Yes | ||
| 6 | PLCB3 | 1662 | 1.879 | 0.5204 | Yes | ||
| 7 | PRKCD | 1917 | 1.749 | 0.5781 | Yes | ||
| 8 | RAF1 | 2767 | 1.403 | 0.5897 | Yes | ||
| 9 | GNAQ | 2997 | 1.320 | 0.6312 | Yes | ||
| 10 | ARAF | 3649 | 1.111 | 0.6414 | Yes | ||
| 11 | PLCG1 | 3717 | 1.086 | 0.6821 | Yes | ||
| 12 | PRKCZ | 4746 | 0.809 | 0.6598 | No | ||
| 13 | PLCB1 | 5051 | 0.735 | 0.6734 | No | ||
| 14 | PRKCH | 9066 | -0.105 | 0.4619 | No | ||
| 15 | PRKCE | 9636 | -0.228 | 0.4406 | No | ||
| 16 | PRKCQ | 9793 | -0.264 | 0.4430 | No | ||
| 17 | PRKCI | 10237 | -0.360 | 0.4339 | No | ||
| 18 | PRKCA | 10469 | -0.407 | 0.4380 | No |
